I embraced every possible reason not to take early literacy data seriously:
- Kindergarteners are too young for testing.
- How can we trust reading data of kids who have barely been in school?
- Shouldn’t we wait and see if students will catch up?
- I don’t even care about these subtests.
- Screening measures don’t tell me what I really need to know in order to teach.
- Testing pulls time away from instruction.
- It feels wrong to label young kids as “struggling readers.” Doesn’t that kind of label stigmatize and limit a child?
I resisted objective data, thinking that cold, hard numbers couldn’t possibly help my students. The data were generic and my students were unique; they needed my attention as they talked about a problem they had with a classmate, their favorite part of a story, or got tangled up in their ABCs. I gave the required assessments, but ignored the data except for when I’d look at a printout and think, “What am I supposed to do about this? There’s only one of me and more than two dozen kids in need of individualized attention.”
Despite over a decade at the elementary level, I’d never worked in a school that actually knew how to use early literacy data and I’d never been in a district that explained its importance. It wasn’t until I was in a district-leadership role that I saw our district-wide reading comprehension data alongside The Ladder of Reading.
Research suggests that 35-40% of students will learn to read relatively easily or even effortlessly with broad instruction, but that the majority of students require explicit and systematic instruction to learn how to read.
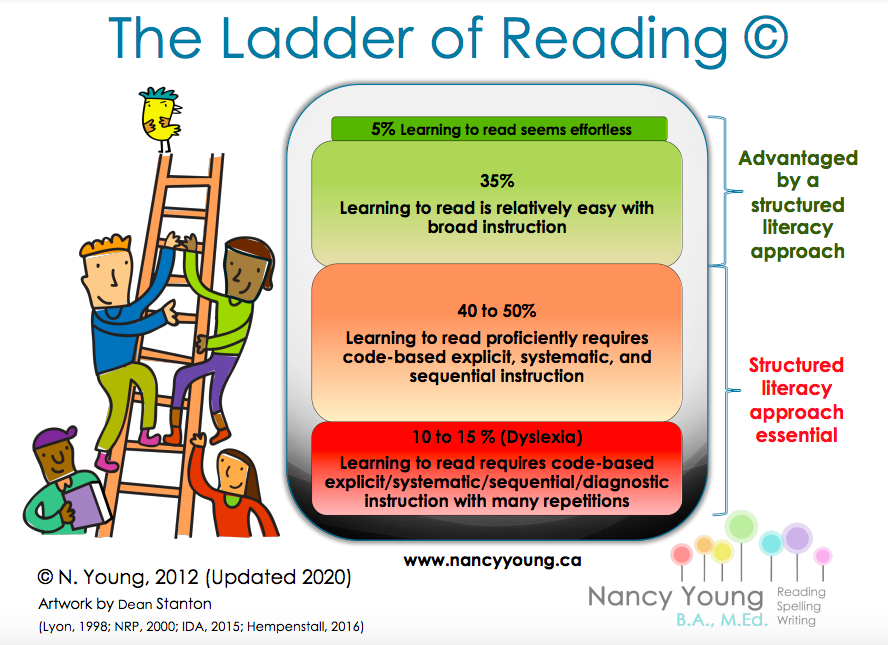
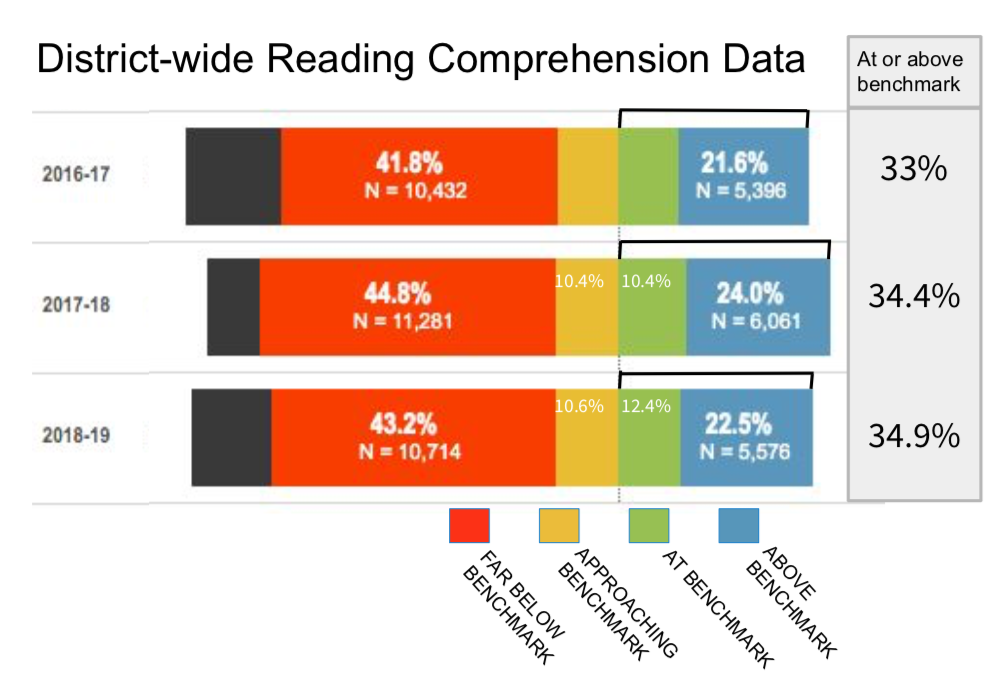
It was clear from our data – upwards of 60% of students reading below benchmark – that we weren’t meeting our students’ needs. It was also painfully obvious that the percentage of students doing well in our Balanced Literacy district was strikingly similar to the percentage of students who, according to Ladder of Reading, learn to read relatively easily with “broad” instruction.
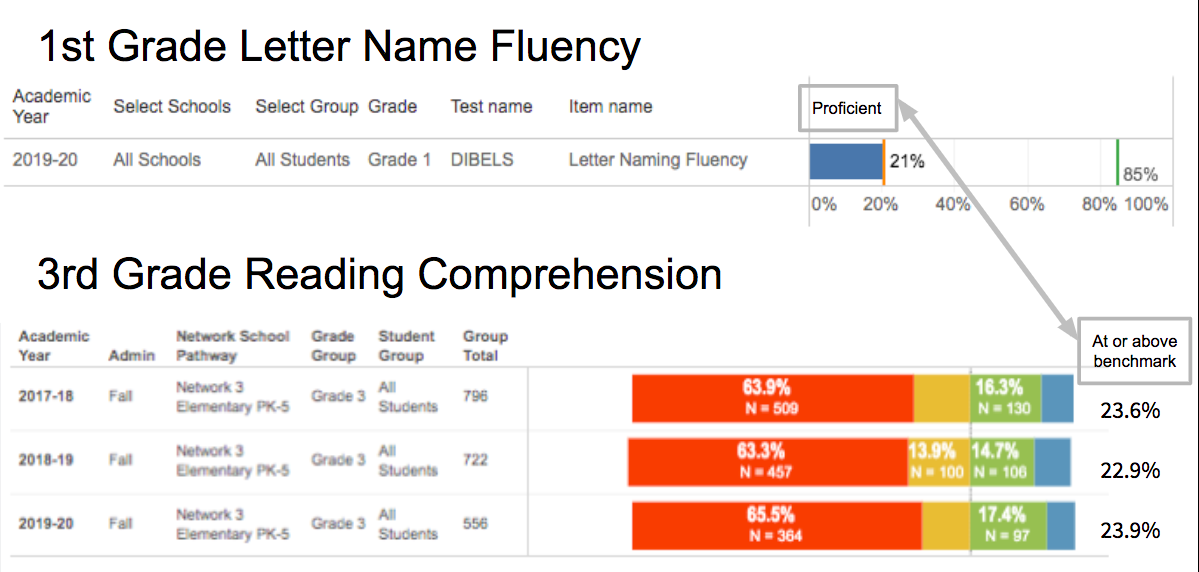
The data revealed early warning signs as well; in our high-poverty schools, where families were less likely to supplement with tutoring, only 21% of our first graders were proficient in naming the letters, an uncomfortably close match with our third grade comprehension data: Only 23% of our high-poverty students were at or above benchmark.
Instead of waiting for students to fail, we could use early screening data, make strategic decisions, devote resources to early literacy instruction, and ensure that every child who needs early intervention receives it before they experience difficulty. We could do this. And yet, most districts and schools do not.
Instead we tend to wait years, until we can no longer hold on to the hope that children will “grow out of” their reading difficulties and only then do we begin to make arrangements for intervention and testing. And the interventions, if and when a child finally receives them, are usually too little and are almost always too late. It’s much harder for an older student, one who has become understandably disengaged in academics, to respond well to foundational skills instruction that would be more appropriate in a kindergarten classroom. A five- year- old can experience glee in learning the difference between K and H or in sounding out the word “sat.” It’s much harder for an upper grade student to be excited about finally learning our alphabetic code.
Once you see predictive data for what it is, you can’t unsee it. And all the excuses for not screening primary grade students for reading difficulty seem silly. Of course we need to know which students require us to be careful, systematic, and explicit with reading instruction!
Objective data from a valid, predictive, reliable early literacy screener isn’t a collection of meaningless numbers; it’s the closest thing we have to a crystal ball, showing us exactly where we need to focus in order to ensure educational equity. Many districts and schools collect screening data, but they don’t often use it to inform how they serve students.

For a printable PDF, click on the arrow in the upper-right-hand corner:


This is an excellent article! I posted your article to my LinkedIn page. I find your observations honest, astute, and reflective of the science.
I intend to send this article to my local Board of Education members.
Keep writing!
Thank you.